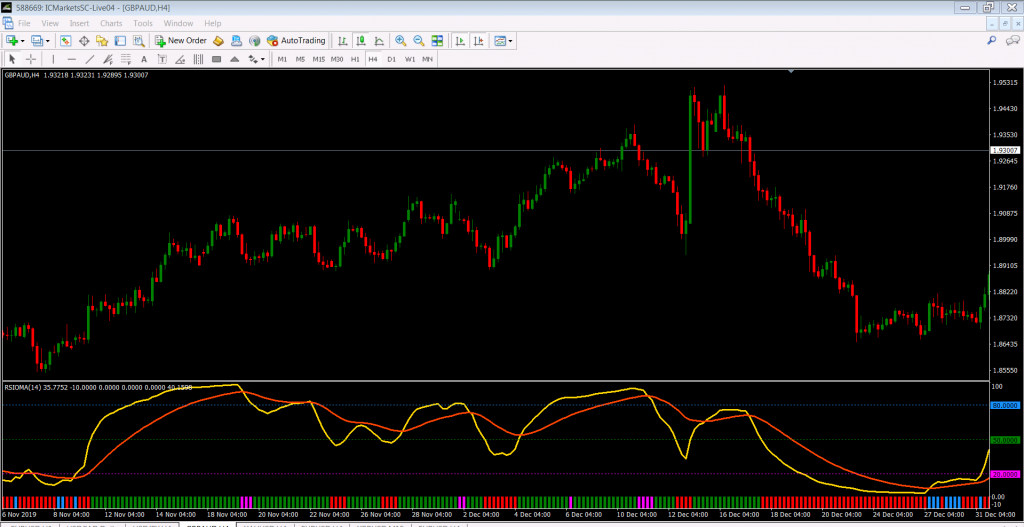
RSIOMA: this indicator takes two moving averages, calculates their RSI (Relative Strength Index) and then also adds a moving average of the calculated RSI. These two lines now can accurately signal the trend changes. They are shown in the separate window where they change from 0 to 100.
On the picture the bold yellow line is RSI of the moving averages, the orange line is its moving average. RSI above MA and RSI above level 50 is a signal of a bullish trend. RSI below MA and RSI below level 50 is a signal of a bearish trend. One can also buy when the RSI breaks level 20 from below and sell when RSI breaks level 80 from above, but those are weaker signals. The histogram provides quick reference. Green lines signal BUY, red signal SELL, magenta mean overbought, blue mean oversold.