The most important geometrical figures in Gann’s concept are circle and square. The most common type of square used is the so-called Square of 9 (it has 9 columns and 9 rows). In this square in the middle, we place the lowest price and clockwise move to the next boxes in a spiral, entering the next higher price by some systematic value. A square is a figure that is to determine the return of a security price.
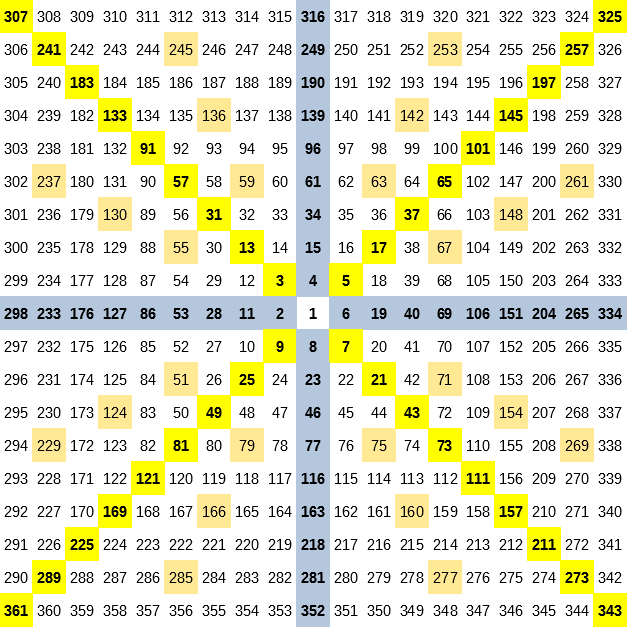
Supports and resist halfway in a vertical, horizontal and diagonal line. Gann believed that all values on these lines are potential turning points to which the investor should pay close attention. Dealing with such a price square is not a simple matter, it involves more intuition than logic.
First of all, Gann did not specify which of the many intersecting numbers are really significant, and therefore all of them are potentially important. The square presents price changes, while the circle is responsible for determining the estimated date when a given price will occur.
The year has 365 days, so Gann brought it closer to 360 to assume that 1 day = 1 wheel. Gann stated that the trend reversal usually occurs when prices have moved a certain distance. These levels are often mathematically related to a number, which can be the “base” number (that is, the lowest level) in the square.
Gann was also the originator of techniques combining geometric angles with prices and time series. As I wrote at the beginning, he argued that there is a perfect balance between the passage of time and price changes occurs on the capital market. This balance occurs when prices rise or fall at a 45 degree angle to the time axis. This is called 1 * 1 angle (unit of elapsed times is accompanied by a change in price by unit). Gann angle lines are drawn between the significant minimum and maximum price and run at different angles. The whole range of executioners, there are 9 of them, creates a fan.