In this article, I will tell you how important the time factor is in our trading and I will give you some tips and reveal a tiny part of my trading method on Forex, I mean, that method will show you how YOU CAN MAKE MONEY on Forex by finding turning points on the chart.
We often do not realize how much time we spend on problems related to price analysis, price behaviour on the chart, and we almost do not take time factor into account. Well, maybe except for switching to different time intervals, like D1, H1 or H4.

In my opinion, this is the biggest mistake of every trader and in order to successfully compete on Forex with hundreds of thousands or millions of other traders, in my opinion, you should spend more time on it.
In this article, I will show you my way of finding the most important turning points on the market, that is, those points where the long-term trend reverses, i.e. after a long period of growth, the price turns back and the market begins to go in a different direction.
The whole process is quite simple, but it contains a lot of details, the omission of which will cause the whole process to fail, so to fully understand what is going on and not lose these details, I recommend you read this article to the end.
So let’s begin.
Finding turning points on the market is associated with WD Gann. Someone who devoted his entire life to finding the edge on the market was WD Gann. Who was WD Gann?
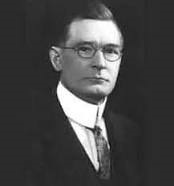
Wikipedia says about him that “William Delbert Gann (June 6, 1878 – June 18, 1955) or WD Gann, was a finance trader who developed the technical analysis methods like the Gann angles and the Master Charts, where the latter is a collective name for his various tools like the Square of Nine, the Hexagon Chart, and the Circle of 360. Gann market forecasting methods are based on geometry, astronomy and astrology, and ancient mathematics. Opinions are sharply divided on the value and relevance of his work. Gann authored a number of books and courses on shares and commodities trading.”

I don’t want to bother you with a long introduction, let me just say that WD Gann was a guy who had been collecting and organizing stock market data for over a year and a half. As you might guess, at the beginning of the twentieth century there was no Internet, people haven’t got a clue about TV, which was invented in the interwar period there is between the First and the Second World War, the radio was just beginning to broadcast and it was the privilege of the riches, so the only way to collect and analyze stock data was to manually process it.
In fact, he devoted eighteen months of his life to these studies. It was hard and tedious work, and theoretically, it gave no prospects of making money in a short time. Over the past year and a half, Gann had to spend money on life, travel, housing and food without getting anything in return for all the hard work he had done.
I’m afraid to think what would happen if this guy had access to the MT4 or MT5 platform; he probably would have finished all brokers and made them bankrupt.
When WD Gann had gained all possible knowledge about markets of that time, when he compared these data, he found relationships and similarities that occur periodically. With this knowledge, he went to the commodity market and began trading there soybeans, wheat, eggs, corn and one good Lord knows what else Gann speculated on these markets.

And guess what happened?
The guy destroyed the market. I mean it. His calculations were so accurate that he could hit the price with a point down to the minute. And as I mentioned, he did not do it based on indicators from the MT4 platform, where you can find Gann fun or Gan square.
Yes, these were his ideas, but this guy knew what to do with these tools, and today, despite the fact that we all have access to these tools, none of us is a millionaire. To make it clear, this video is not about the tools available in trading platforms, such tools as Gann squares, Gann fans and all other related things. It would be too simple and trivial.
There is a lot of articles online, on YouTube or bloggs written on topics related to the Forex market. Of course, if you want, I can write a separate article on this topic. Let me know in the comments below. I will gladly help you. Whenever you want.
Gann mastered the secrets of the stock market based on his own set of tools, although he was reluctant to share them, and to this day no one knows exactly what methods and techniques he used as an effective trader.

Sorry guys that it takes so long, but this introduction is necessary for a full understanding of what I want to explain to you. In a moment we will go to what is most important to you, that is, the technical part or the practical part. Still bear with me for a while. We’ll get there in a moment.
Gann described his techniques and trading methods in the book “The Tunnel Thru the Air; Or, Looking Back from 1940” published for the first time in 1927. The book is available online in pdf format, it is free, so you can easily find it, but its content may disappoint you.
This book is a story about the life of a guy who makes a career from zero to hero as a trader on the commodity market, but the trading methods of the main character of the book are so deeply hidden and encrypted in the content of the book that even the most sophisticated encrypting software is not able to find any clues on this topic for the next thousand of years.
The only way to find the golden Grail WD Gann wrote about is the human brain, its infinite possibilities, which, combined with human curiosity, will certainly decipher Gann’s trading methods one day.
Maybe it will be you who will succeed. It could be you; if you have a passion to discover something completely new then “The tunnel thru the air” will definitely interest you. I recommend reading this book and reading it carefully, slowly and thoughtfully. I read it several times and I find something new every time.
One important thing; I don’t advertise here any publisher or seller of this book. “The tunnel thru the air” is a free and publicly available book. I mention it here because I think this book will broaden the topic of this article.

The story described in the book is not very thrilling one for an ordinary mortal, which is why Gann did not get the Nobel Prize in literature, but if anyone could decipher the Gann code, then the Nobel Prize in economics awaits him. And of course eternal glory, but let’s get back to the topic.
WD Gann considered the time as the most important factor when it comes to making trading decisions, so he had incorporated the time factor into his trading. And he did it big time.
W.D. Gann said he believed that time was the most important factor in forecasting market movement. He felt that time would overbalance space and volume but stop the momentum.
He used to say: “The future is a repetition of the past, he used to say, and each market movement is working out time in relation to a previous time cycle.”

For this purpose, Gann created what we call the Gann square today. A square of this type was already used in ancient Greece, they were used by the Sumerians in Mesopotamia, and the first sources of numerical tables ordered in this way were found in Sanskrit, a language already used 1500 years before the birth of Christ, that is, three and a half thousand years ago. But it was Gann who first used it to predict future market prices.
Something we call the Gann square has little to do with what you see in the charts on any trading platform like this one here.
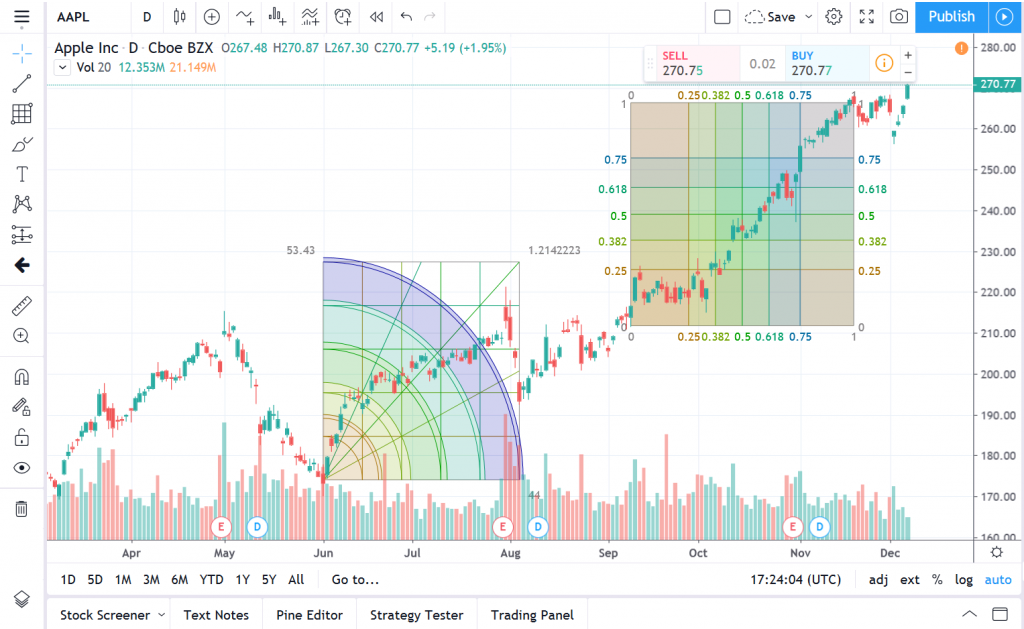
Gann Square looks more like this one below.
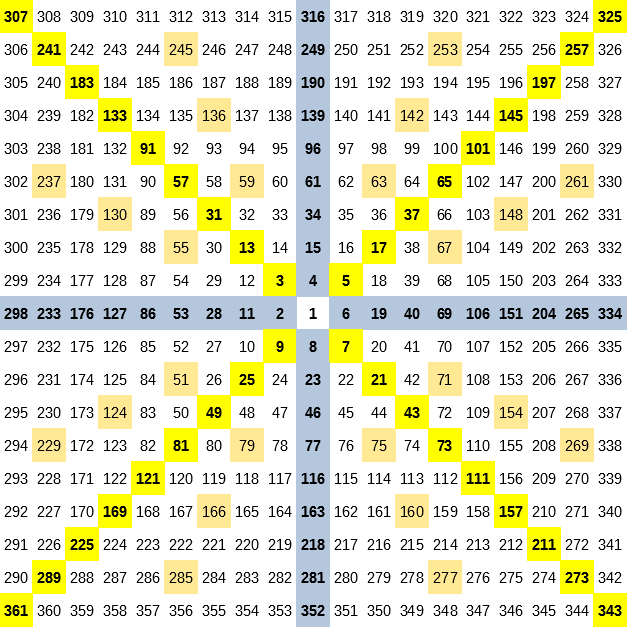
Or like this one
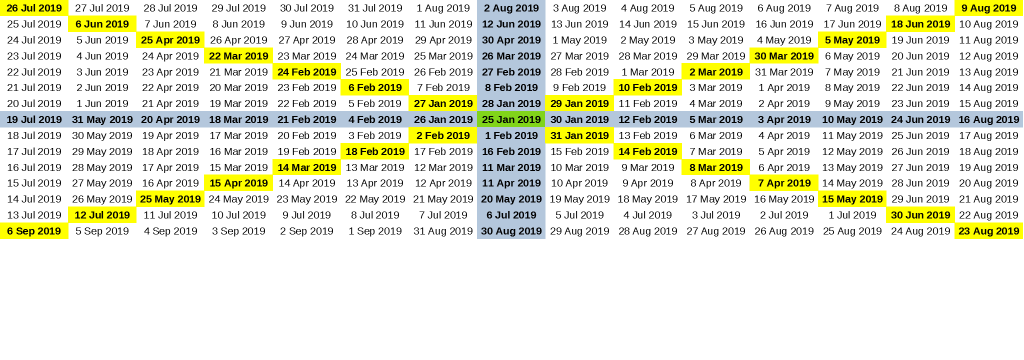
What you see exactly is a rectangle, but take my word for it this rectangle retains all the properties of a Gann square and was created on the same principles.
How is the Gann square built? Its creation in Excel or Libre Office spreadsheet is very simple and does not take much time. I will show you right now how to make such a square within a minute.

Give me this brief moment, because this is where the real magic of the Gann square begins, the magic which will allow you to predict price turning points in the future, no matter if we are talking about the Forex market, the commodity market or the stock market. Gann square works in all markets, regardless of weather, hurricanes or political events such as elections, politician’s resignations, wars and so on. Gann considered all these events to be the result, not the cause. He found the reason elsewhere, but we will talk about this at a later stage of our considerations.
So let’s start with the topic.
In order to begin, first of all, we need to format our spreadsheet. Sorry guys, maybe not everyone can do it, so I owe this explanation to those who before this excel session at school just had to go on holiday, or maybe they are dinosaurs like me and the only way to count at school was an abacus. If you how to format spreadsheet in such a way to get square cells, just skip this step and come back in thirty seconds.
So we open the spreadsheet and set each cell so that they all have the same height and width. We simply create cells in the form of squares. So click in the upper left corner of the sheet, thus selecting all cells in the sheet, click Format / Row / Height and set the cell height to 1 cm. Then click Format / Columns / Width again and set the cell width to 1 cm. We now have a whole 1 x 1 centimeter sheet of squares. By still clicking on Align Center and Center Vertically we have a beautiful sheet with a formatted position for each value and we can now start entering our data.

In the middle of the page, we’re entering first figure, number one. To the left of it, enter two. Above two, enter three. To the right of the three enter four. To the right of four, enter five. Enter six below five. Enter seven below six. To the left of the seven, enter eight, and to the left of eight enter nine.
We’ve already formed a beautiful square, haven’t we?
The whole idea of building up a Gann square is to enter the data clockwise. After the number nine, we move one field to the left, enter the number 10 and then we start to enter the data above it until we find a free cell on the right side of the number entered. Then we enter the next numbers to the right of the entered numbers until a free cell appears under the entered number. Then we begin to enter numbers below those already entered until we find a free cell on the left of the number entered. Then enter the next number to the left of the number already entered and continue as shown. Very simple, right?
The worst is over, guys. If you have survived to this point, my heartfelt congratulations. I am half-dead myself, but it was necessary to show you how you can build a Gann square yourself and expand it indefinitely, although it is not necessary. Now you already know how to create the tool you need to work further with anticipating turning points on the market.
I mean it. We will use the Gann square to find such POINTS IN TIME.
I repeat it again: the Gann square is a tool for finding TURNING POINTS IN TIME.
If the right price appears at the right time, then the market returns.
Obligatory and indisputably.


