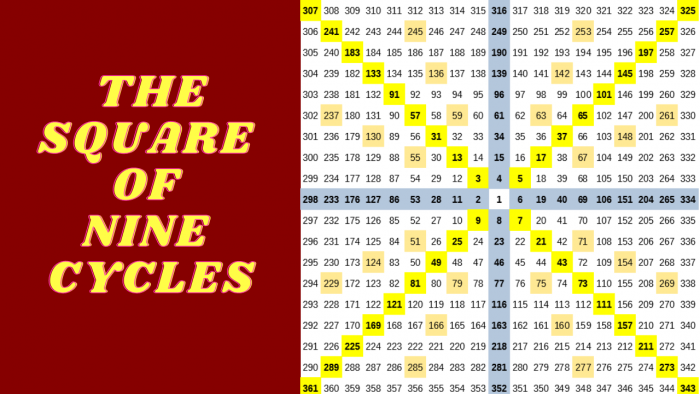
What is WD Gann’s secret formula for calculating future market turning points?
In the famous book “The Tunnel Thru The Air”, page 75, WD Gann begins the chapter with the following words: “In making my predictions I use geometry and mathematics, just as the astronomer does, based on immutable laws.”
On the same page, in the last paragraph, Gann repeats the same statement: “My calculations are based on the cycle theory and on mathematical sequences. History repeats itself. That is what I have always contended, — that in order to
know and predict the future of anything you only have
to look up what has happened in the past and get a correct base or starting point.”
Is this the key to WD Gann’s secret formula?
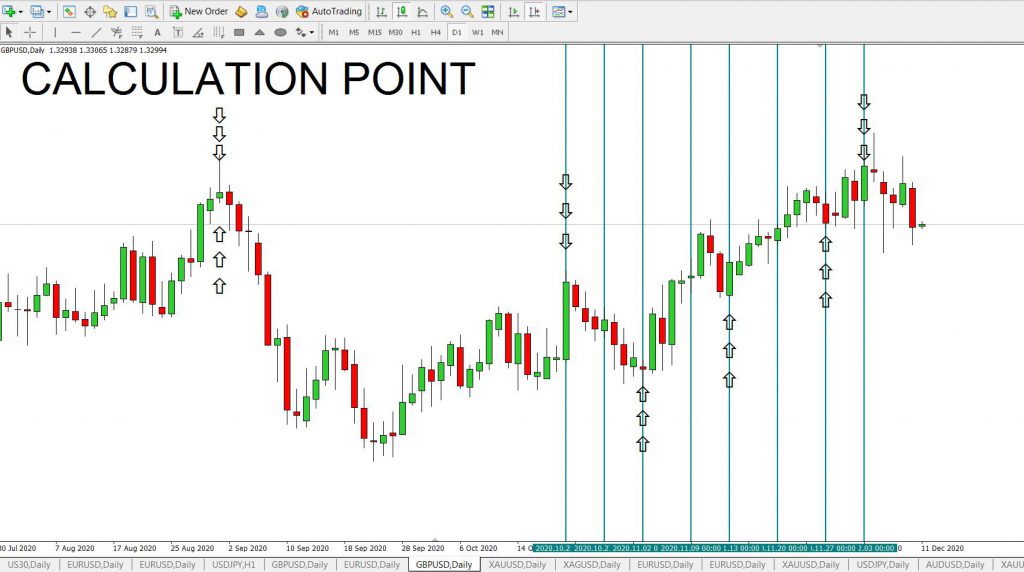
The chart above is an example of how you can predict future market turning points.
Based on the starting point local top on the GBP/USD chart as of June 10, 2020, and based on the closing prices of that day, I used a mathematical formula derived directly from the harmonic properties of the Square of Nine and calculated the nearest potential tops and bottoms of the market swings in the future.
The dates calculated from the closing price conversion as of June 10, 2020, into time represent the eight vertical lines shown in the first chart.
| 21/10/2020 Wednesday |
| 27/10/2020 Tuesday |
| 01/11/2020 Sunday – the nearest trading day Nov. 2, 2020, |
| 08/11/2020 Sunday – the nearest trading day Nov. 9, 2020, |
| 14/11/20 Saturday – the nearest trading day Nov. 13, 2020, |
| 20/11/20 Friday |
| 27/11/20 Friday |
| 03/12/20 Thursday |
As you can see from the eight calculated results, five of them indicated EXACTLY the top or bottom of the local swing. Only one question remains: is 62.5% accuracy enough for successful trading? Let’s try to calculate it.
For the sake of simplicity, let’s assume the effectiveness at the level of 60%, i.e. for every ten transactions we have six in profit, and the remaining four are ended with a loss. Let’s also assume that our take profit is twice the stop loss. Let’s also assume that our stop loss is $100 each time and our take profit is $200.
Six transactions @ $200 profit each = $1200 in profit
Four transactions @ $100 loss each = $400 in loss
TOTAL NET PROFIT ON TEN TRANSACTIONS = $1200 – $400 = $800 !!!
As you can see in the example above, when you use geometry based on the Square of Nine and simple mathematics, you can get quite a high efficiency as a trader. The above calculation shows that with a capital of $ 300 you can get a 266% return on capital in a very short time. Please note that our trading period is less than two months!!!
The above-mentioned 62% return on capital looks pretty good, doesn’t it? I would like to add that there are no contraindications to filter the previously calculated dates and get an even higher rate of return.
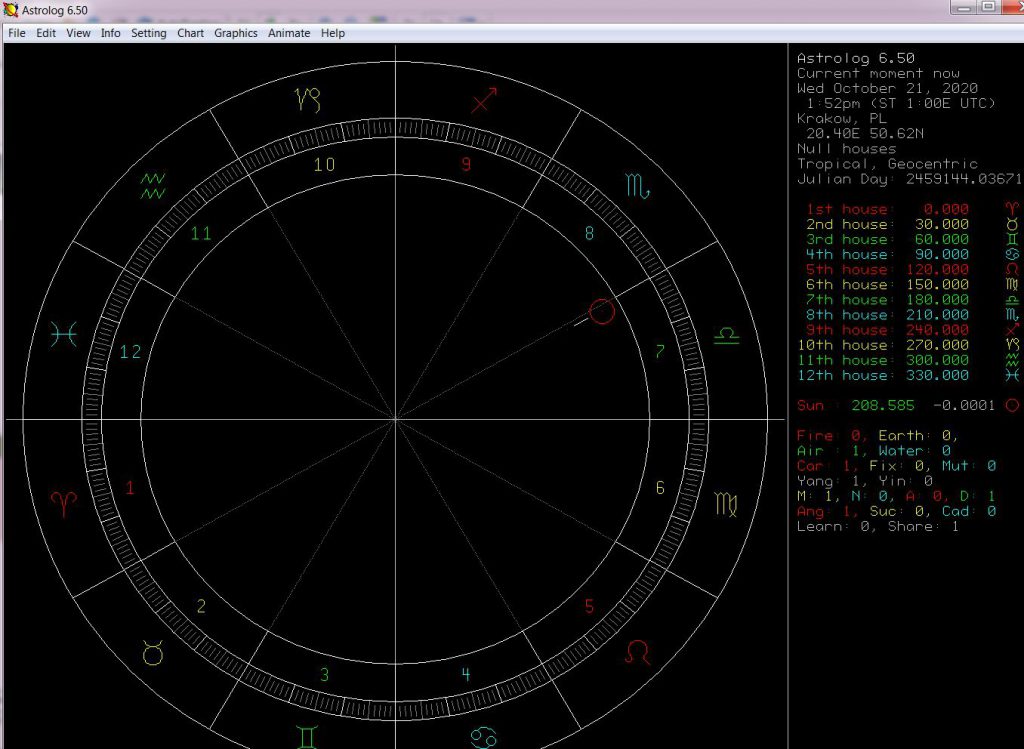
In Figure 3 above, it is clear that the Sun is just finishing its journey in the sign of Libra on October 21st, and on October 22nd it enters the sign of Scorpio. The Sun’s Ingress almost always heralds a local swing of the market, therefore the calculated date of October 21st is a highly likely market turning point.
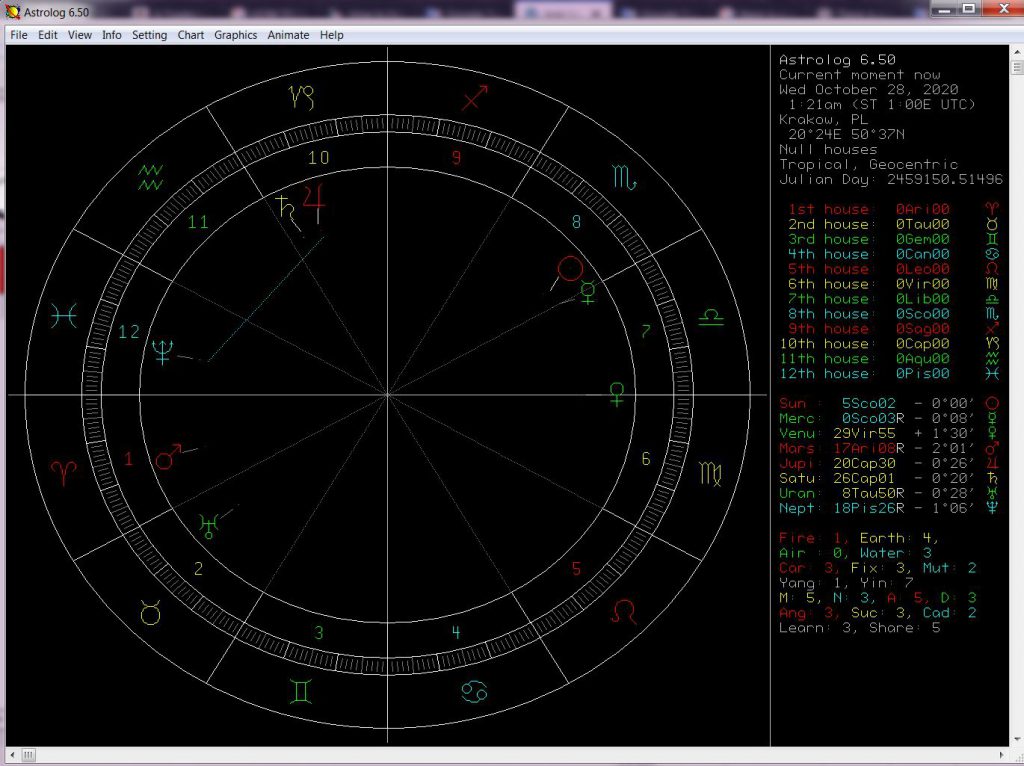
On October 27, 2020, my calculations based on the Square of Nine marked a local turning point. The market that day made a one-day correction after three days of decline. As shown in Figure 4 above, a double ingress takes place on October 28. Venus enters Libra, as does Mercury which retrogrades from Scorpio back to Libra. Therefore, at the close of the daily candle on October 27, the further decline should be expected.
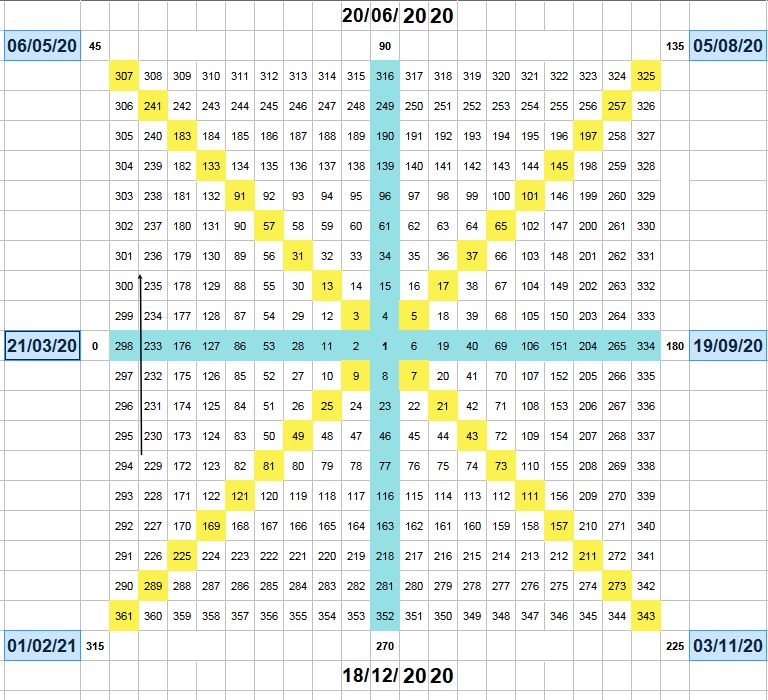
The next date calculated, November 3, 2020, is one of the key days of the year. In fact, we have eight such days each year. WD Gann believed that the Square of Nine divides a full year harmoniously. The places indicated at the end of the cross and diagonals of the Square of Nine are important turning points. These dates result from dividing the year into eight equal parts. WD Gann always starts the year on March 21. Look at these harmonic dates in Figure 5 below.
| 06/05/20 | one eight of the year |
| 20/06/20 | two eights of the year |
| 05/08/20 | three eights of the year |
| 19/09/20 | four eights of the year |
| 03/11/20 | five eights of the year |
| 18/12/20 | six eights of the year |
| 01/02/21 | seven eights of the year |
| 21/03/21 | one full year cycle |
A graphical representation of WD Gann’s harmonic year division concept on the Square of Nine is shown in Figure 6 below.
In my direct calculations from the table in Figure 2, the date of November 9, 2020, appeared. Is this really the right date to change the direction of the market?
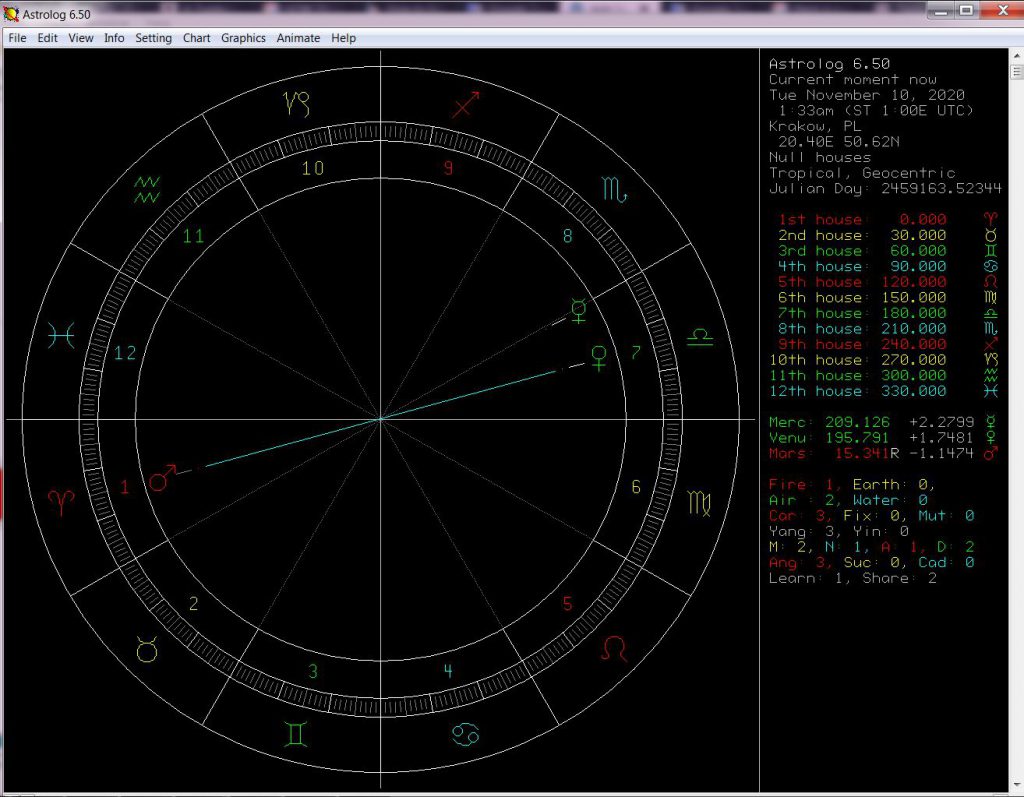
The world has never been perfect. The same is the case with simple calculations. November 9th is definitely not a good day to enter the market. The next day an opposition between Mars and Venus will take place. In the same time and November 11th, Mercury enters the sign of Scorpio. The same day two fast planets will be in opposition. The warrior Mars and the beautiful Venus is just additional confirmation of the potential reversal. Figure 7 above shows the positions of Mercury, Venus, and Mars on November 10th.
November 13 is not only a calculated turning point for the market based on the closing price of June 10, 2020. The same day was indicated by a calculation based on the peak on December 13, 2019, and the bottom of March 20th this year. I call it a triple confluence of price and time square and it is a strong signal of market reversal.
On November 20th, the market continued its way north after a one-day correction when the day before a pin bar on the daily chart was formed. The triple confluence on November 13th suggested a stronger move, so November 20th was another day that indicated a change in the direction of the market compared to the previous day, so the continuation of the move to the north was easy to predict. This was a clear signal to increase market involvement by adding another position.
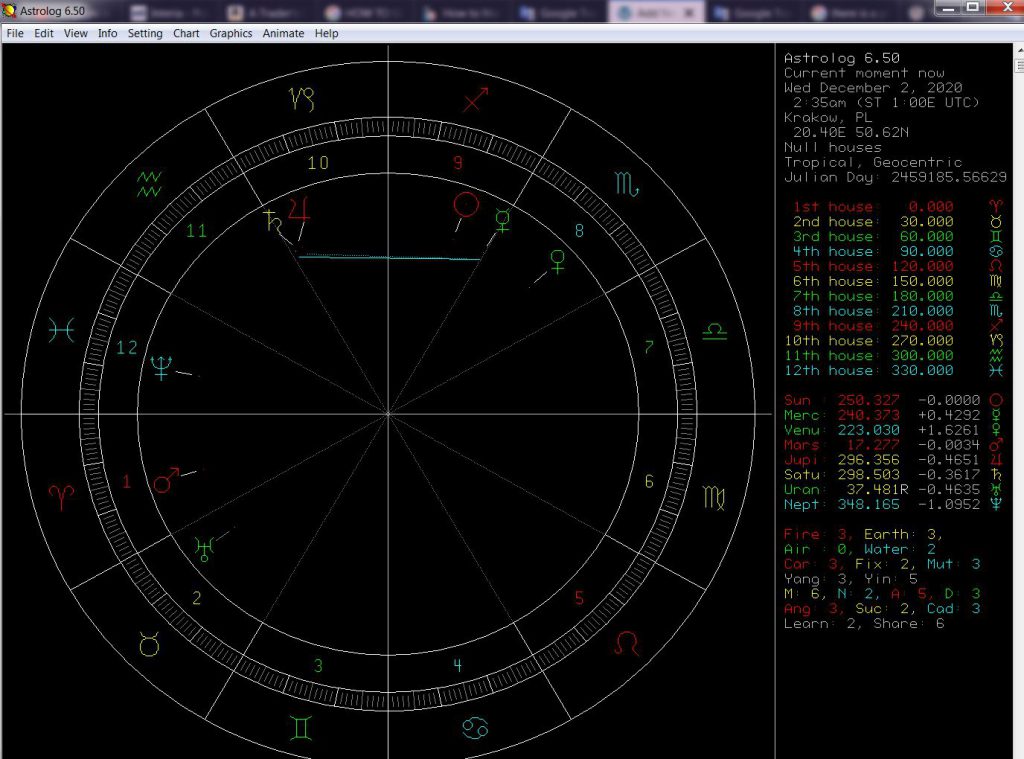
December 2nd is Mercury’s entry into Sagittarius. This market entry is a piece of cake. No brainer.
So our chart, after filtering and the above analysis, looks like the one in Figure 9.
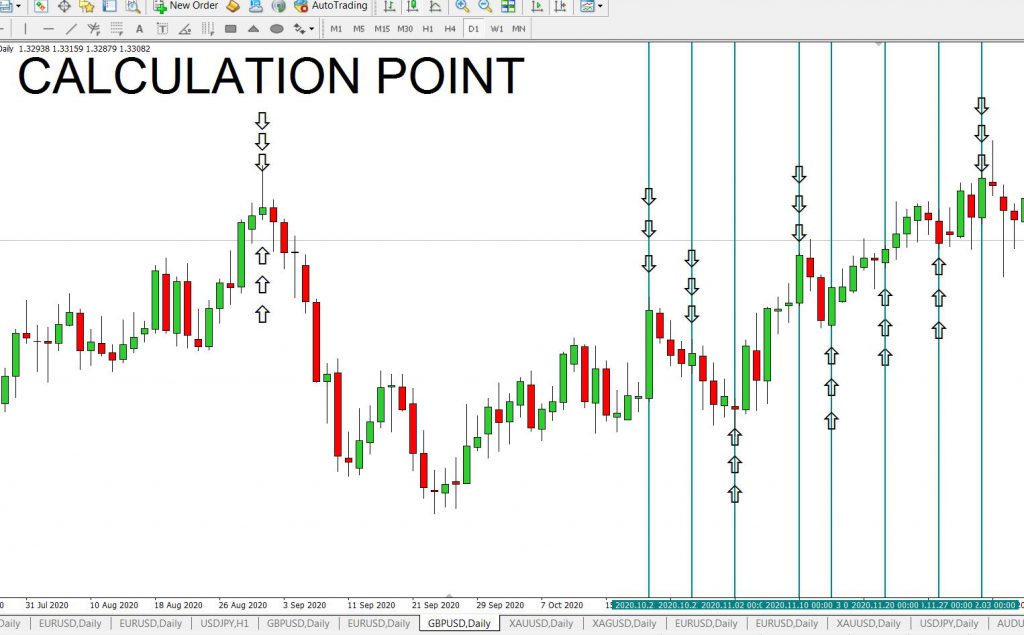
It turns out that after properly filtering the pre-calculated potential turning points of the market and introducing appropriate adjustments, the effectiveness of the calculated turning points is definitely higher than a modest 62.5%. It is up to your own judgment to calculate this effectiveness.
Let me quote WD Gann once again:
“In making my predictions I use geometry and mathematics, just as the astronomer does, based on immutable laws.”
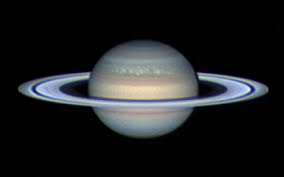
In the example above, I used math and geometry to calculate these dates. You can call them WD Gann’s secret formulas. Exactly as Gann pointed out in “The Tunnel Thru The Air”. Mathematics is a series of formulas that I myself adopted from works on market harmony and which are the result of my studies.
For the analysis, I also used a meaningless fragment of the sentence “as the astronomer does…”. These nineteen letters of the quote are another key to the trading Universe of WD Gann. Just as important as math and geometry.
The good news is that you can learn aspects of the planets in half an hour. There are tons of articles and videos on the web about this.
Would you like to learn the secrets of the Square of Nine and how to use it effectively in trading?
You can learn all that hidden knowledge during my private online mentoring sessions via Skype. For more details, please send me an email to the address below.
